Wednesday, February 28, 2018

Pretium - everything is great

Good news, Pretium at the BMO Conference is telling us that everything is great (link), no need to worry. Production at Brucejack is swell, and everything is going to be super-good after the mill expansion. For fun, they are looking for the source porphyry, because, why not.

We also got the Brucejack ramp up production figures, you know, the ones where grade and ounces produced went down. We actually get to see the 'official' head-grades, and they were worse than Otto calculated (link).

Tonnes up, production down - Pretium going for the win!

They also included a nice long section of the Brucejack block model, which was interesting.


The reserves aren't nice and consistent, there are distinct area of high and low mineralization, but there is an awful lot of the Proven Reserve blocks that are green and yellow (i.e. 5-10 g/t Au).

This isn't uncommon, but if Pretium want to maintain consistent production level, they'll need to be very good at balancing the production from high and low grade areas (mine scheduling), and for me, the erratic nature of the mineralization is the reason why Pretium gave such a huge range for the H1, 2018 production. They just can't quite nail down the grades.

TL:DR version - it is going to be hard to consistently maintain a head-grade at 14.5 g/t Au.

I apologize for the next section, it contains a very naughty word. If you are sensitive, please go here (link)

It would have been interesting to have seen a a slide on reconciliation to see why they had missed their targets, was it due to:
  • Poor reconciliation - mined graded not equaling reserve grade
  • Slow development - unable to access proposed 2017 production areas and forced to mine peripheral, low grade zones.
We all know it is grade reconciliation, hence the reason they are doing a new grade control program and drilling the stopes on 5-7m centers. However, the slide that concerned me the most was this one (slide 17)


According to Paths, Pretium are retards, and are actually using the Reserve figures in their own technical reports (who the feck does that?!?), and are projecting that after the mill is expanded, the 2019 production will be:
  • ~580,000 oz Au per year 
  • A head grade at the Reserve Grade - 14.5 g/t Au*
  • AISC @ ~$570/ounce
*if you plug the numbers into excel you get a recoverable grade of 13.2 g/t Au or a recovery rate of 91%

So, to do this, all they need to do is solve the grade control issues, improve mine scheduling, improve recovery, and increase the underground development. Nice and easy.

If they don't manage this, at 3,800 tonnes per day each 1 g/t decrease in head-grade means a drop in production by 44,000 ounces, or $57M decrease in revenues. That is a lot of money, especially if you want to do this:


Monday, February 26, 2018

Alacran - Sting of the Scorpion

PDAC season is in full flow, and lots of companies are pushing out press releases to telling us that they are great, everything is going super-well and please don't ignore us and sell our stock as we have no real news.

One of my favorite pig in lipstick press releases was from Cordoba Minerals (link), not only announcing an updated resource for Alacran, but telling us that theyz got cobalt az well, m8.

Fuk uz Forst Cobalt


We'll ignore that and look at the resources.

Original, Jan 2017 resources

hard to read, but resources calculated at $1300/oz Au and $2.50/lb Cu


New and improved resources:

@ $1400/oz Au and $3.15/lb Cu

I liked the interesting metal prices used, Cordoba was a little generous with the gold price, but why don't we do some maths and see how the project has grown with another successful year of exploration.

I mean, look at that, they increased resources by ~27%. That deserves a good hug and a nice pat on the back, we'll ignore the fact that as the tonnes have increased, those nasty little copper and gold atoms have been efficient with their New Year resolutions. Those pricks have been on a diet!


and given the deposit a stunningly unimpressive negative increase in contained metals.


  • Copper 
    • Grades dropped by 22%
    • contained metal stayed essentially the same
  • Gold
    • Grades dropped by 32%
    • contained gold dropped by 15% or 94,000 ounces
So, basically you've made Alacran worse. Well done!


Friday, February 16, 2018

GT Gold - don't sniff the Saddle

GT Gold Corp's saddle deposit was causing a lot of excitement last year and have recently announced some decent new results (link and link).

Summary

  • Drilling has defined a small, moderate grade deposit.
  • Moderate expansion potential:
    • South Zone: partially open to the East and West
    • North Zone - TTD057 hit good values, but surface Au samples suggest that this zone is small.
    • Porphyry mineralization in hole TTD062 is interesting, but not economic. Highest grade zone appear to be restricted to narrow zones (dykes?).
  • Decent Au recoveries from initial metallurgical studies.
I was pleasantly surprised that GT gold include a full breakdown of the DH assays (link) on their website, and as this is a new project for me I want to look at 3 areas:
  1. Size
  2. Upside
  3. Potential problems
For your viewing pleasure, you can download the Leapfrog viewer file from here (link). Please note, I haven't found the RC collar information, so they are not included.

Size

I did my normal thing, brought in the assays, had a look at the data to see if there were any trends confirm GT Gold's interpretations, that gold occurs in a series of steeply dipping veins.
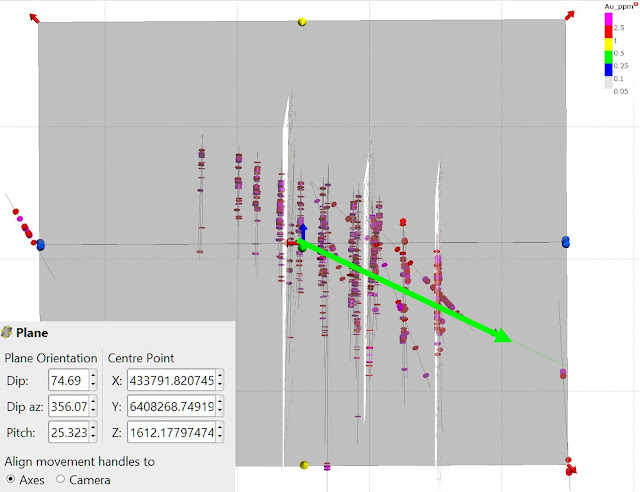
Green arrow = mineralization plunge

I used this trend to create a series of grade shells.


To calculate a guesstimate of contained gold.


It looks like GT Gold have defined a small, but moderate grade resource. How can they make it bigger?


Upside

I want to see how easily GT Gold can expand the gold mineralization. So I decided to compare the drilled gold zones against the prospect-wide soil sampling maps found in the 2016 technical report.

Gold


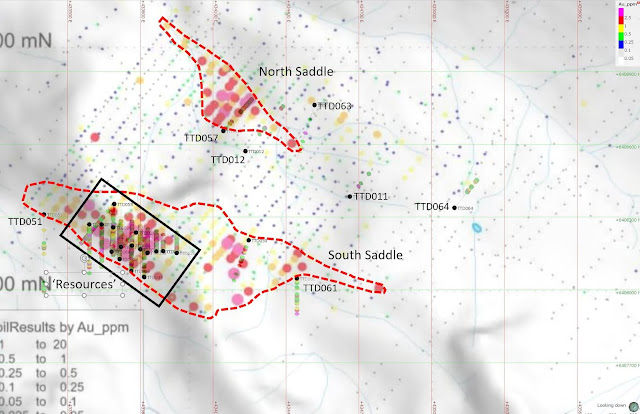
Au DH assays and Au in soil

Arsenic


Au DH assays and As in soil
We can see that surface gold and arsenic correlate well with the gold mineralization hit by the drilling. You can also see that the 2 large soil anomalies haven't been completely drilled.

South Saddle

proposed hole = cyan lines
The South Saddle Zone has been well drilled, but we can see that the Au soil anomaly continues for another 300m to the NW. We can also see that hole TTD051 missed, at GT gold should drill a hole (highlighted) from this platform to the NE to check for the continuation of the multiple Au zones hit in drill-hole TTD053

We also see a partially tested anomaly ~250m to the East. Drill hole TTD059 hit several >1g/t Au structures and a few holes between this hole and TTD028 will test the continuation of the main South Saddle deposit to the east.

GT may also want to drill a DH to the N from the platform of hole TTD061 to test another small Au soil anomaly to see if these three zones link up.

North Saddle


The North Saddle gold anomaly is virtually untested, and is 400m long and ~250m wide. The anomaly does appear to be following a drainage and may just be an erosion anomaly, but drill-hole TTD057 hit multiple >1g/t Au structures along the eastern edge of this anomaly and a couple more holes should be drilled to see if there is anything bigger to find in the area.

Porphyry

Hole TTD062 hit some weakly mineralized porphyry (210m @ 0.16% Cu and 0.14 g/t Au - i.e. waste) and the hole was drilled into the center of the large magnetic anomaly, so it it doesn't look like it will turn into anything.

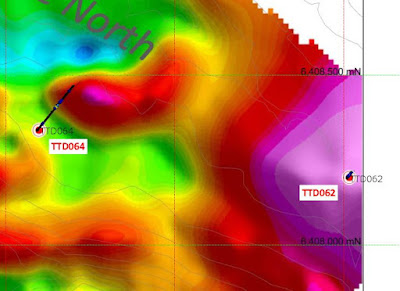
Magenta = magnetic high


Regionally

The 2016 technical report does discuss additional targets, I've been happy to see that there is good correlation between soil Au and As and drilled mineralization, and maybe a good step would be to expand the soil sampling program across the project, and if GT gold want to save a few bucks (and get quicker results), they could use a pXRF on the soil samples and map out the Arsenic as a proxy for gold distribution.

Metallurgy

We got a Valentine's gift from GT (link) with some initial metallurgical results. I quickly checked Head grade against recovery to make sure that GT tested material with different head-grades (it is common for companies to only test the 'best' material which can skew the results).


We see a nice range of head-grades from low to high, and the recoveries are sitting nicely around the 80% level. I didn't see anything in the text to explain why 2 composites had 0% recovery, it would have been nice to have had a bit of text explaining why. It would have been nice to have seen a summary of ore type (oxide, mixed and sulfide - if it is important) and maybe where the samples had come from, but these are minor niggles.

I've created a new view showing the location of the Cu assays in the DH data (link)

Conclusion

GT gold have defined a small, moderate grade gold deposit. There is reasonable expansion potential laterally, the depth extents to the South Saddle appear to be well drilled), and my gut-feel max size for Saddle/Saddle north is sitting around ~1Moz @1 g/t.

The metallurgical studies are positive, and appear to minimize any potential impact that the elevated As could have had on the deposit.

However, I can't see, from the data presented, how GT will significantly expand the project to a size where larger companies would be looking at acquiring it (say around 2Moz). Maybe with some regional exploration, several additional gold zones could be defined for drilling later on this year.

The porphyry potential, albeit from a single hole, seems to be minimal.


Friday, February 2, 2018

Pretium - Opportunity costs

Archaeologists near Stewart, BC have discovered what is believed to be the missing front cover of the Brucejack Feasibility study.

Thank you Grant Naylor

If genuine it belongs at the beginning and is believed to have read "To my darling Daniela. All figures portrayed within this report are fictitious and any resemblance to the truth is purely coincidental"*

*Just my warped sense (lack) of humor.

Why don't we state the obvious:

  1. The mine is profitable
  2. The first 6 months production was a big miss
  3. H1 2008 guidance - will be a big miss when compared to the FS

The nice thing about Brucejack is that we can compare the actual production figures against Tetra tech's feasibility study.

Here are the projected gold and silver projections:


1st Year production (essentially July 2017 to June 2018)

  • Feasibility Study = projects 402,393.74 oz production
  • Pretium guidance:
    • Low end = 302,000
      • 100,000 oz or 24.85% less than the FS
    • High-end = 352,000 oz
      • 50,000 oz or 12.4% less than the FS
What does that mean? 

Simply, Pretium will be receiving much less revenues from Brucejack than original calculated by:


  • At $1100/oz = $55.4M - $110M less revenues for Year 1
  • At $1300/oz = $65.5M - $130M less revenues for Year 1

Ouch...